library(tidyverse)
library(readxl)
mofo <- read_excel("dados-diversos.xlsx", "mofo")Histograma
mofo |>
   ggplot(aes(treat, yld))+
  geom_col()+
  facet_wrap(~study)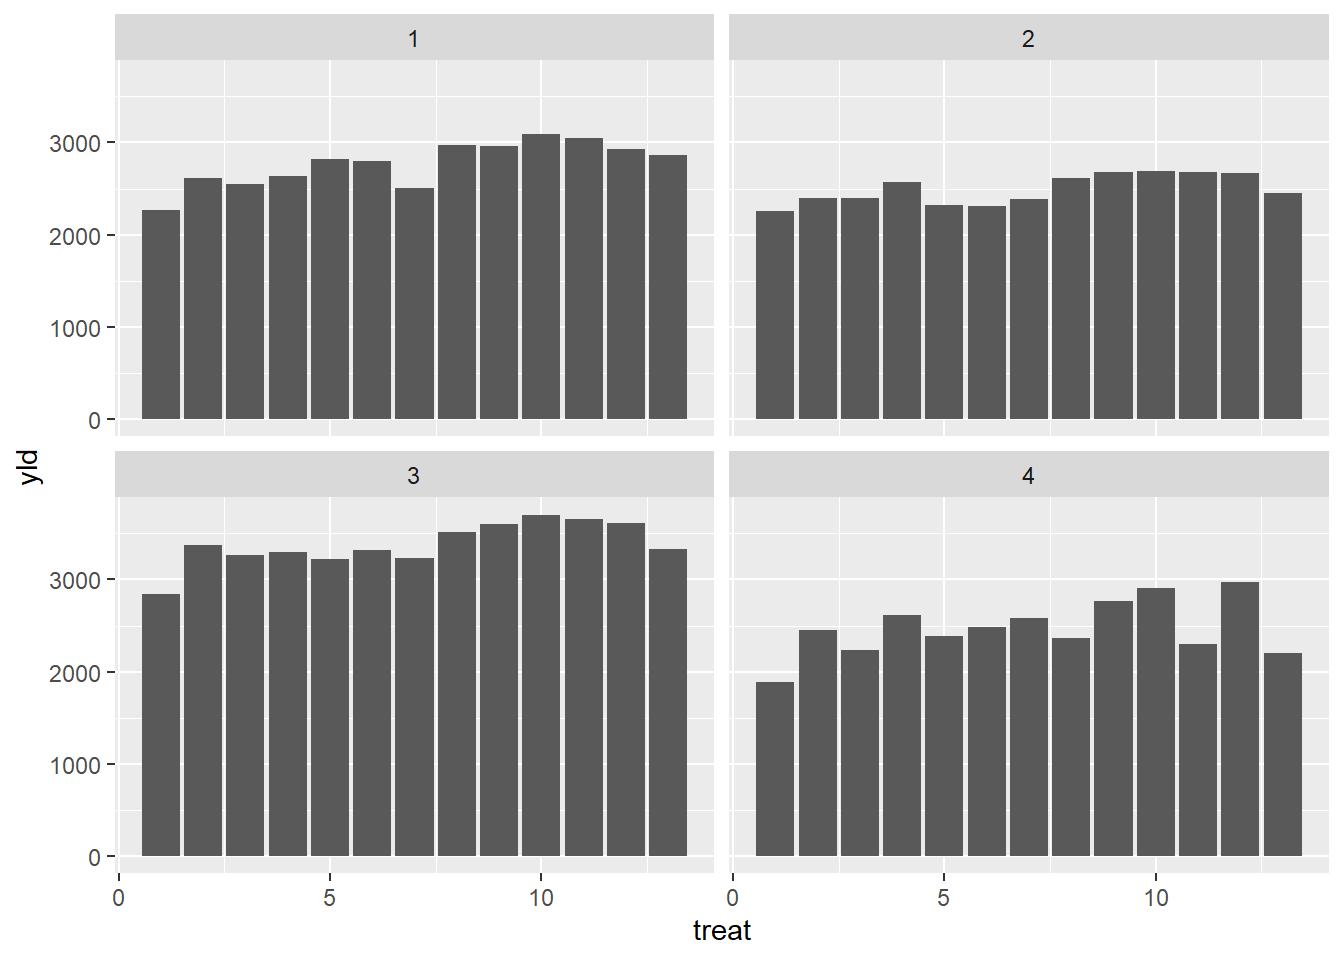
hist <- mofo |>
  ggplot(aes(x= scl))+
     geom_histogram(bins = 10, color = "gray40", fill = "gray80")
criando uma variavel
mofo2 <- mofo |>
   mutate(scl2 = sqrt(scl))
hist2 <- mofo2 |>
ggplot(aes(x= scl2))+
geom_histogram(bins = 10, color = "gray40", fill = "gray80")library(patchwork)
(hist | hist2) 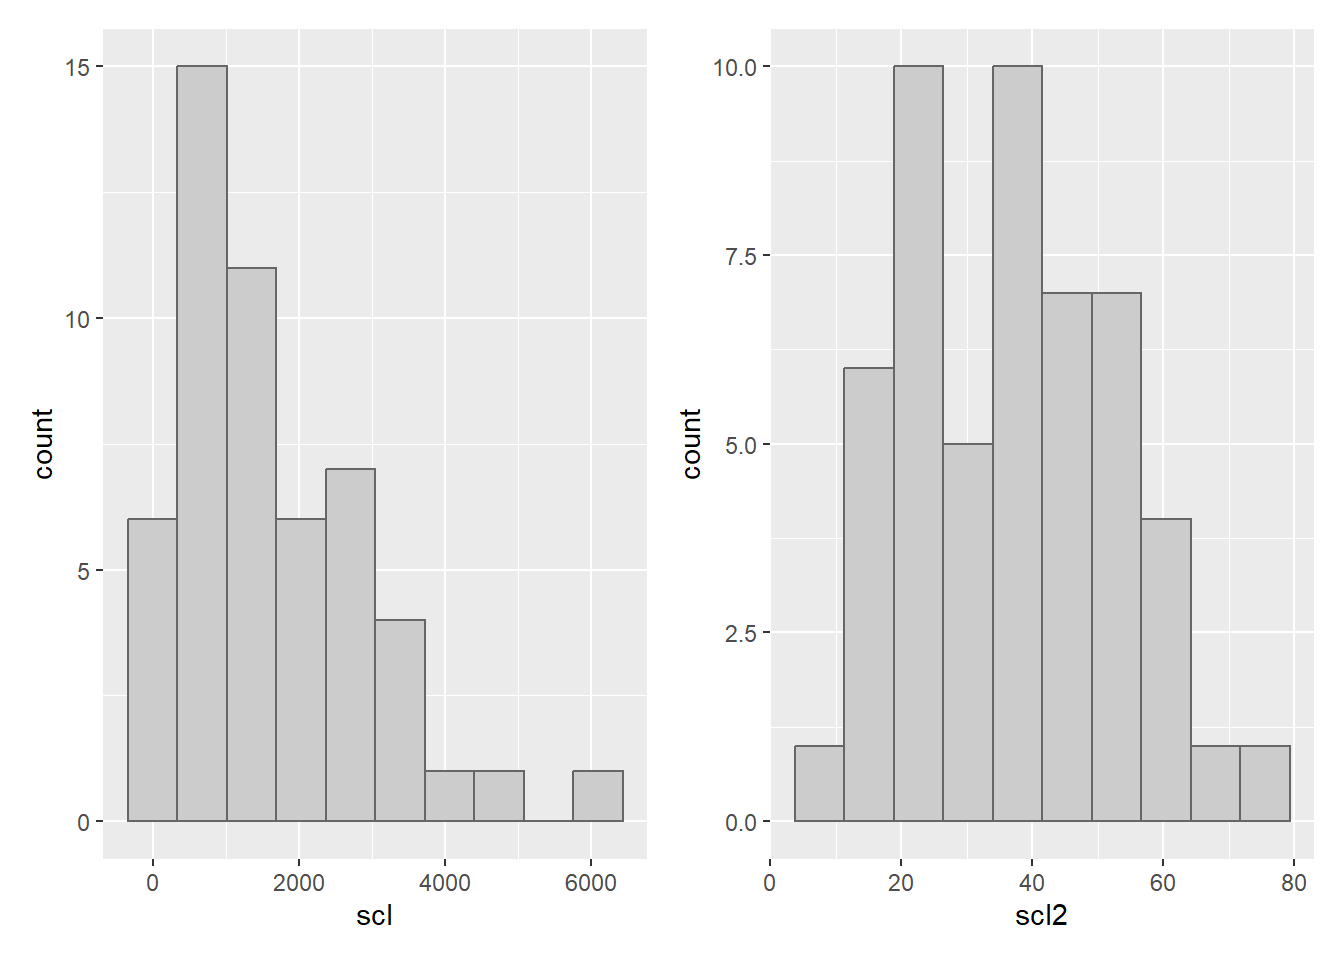
arrange reordena, mutate cira uma variavel nova MUTATE CLASSIFICA
survey <-
  read_excel("dados-diversos.xlsx", "survey")

survey |>
   filter(state == "RS") |>
  count(species, residue) |>
  arrange(n) |>
  rename(res = residue) |>
  mutate(n_class = case_when( n < 30 ~ "baixa",
         TRUE ~ "Alta"))
# A tibble: 4 × 4
species res n n_class
<chr> <chr> <int> <chr>
1 Fspp corn 22 baixa
2 Fspp soybean 26 baixa
3 Fgra corn 147 Alta
4 Fgra soybean 255 Alta