library(readxl)
library(tidyverse)

fungicidas <-
read_excel("dados-diversos.xlsx", "fungicida_campo")Anova em DBC
Anova em DBC
modelo com anova com bloco severidade em função do tratamento + bloco mesmo quando o bloco não é significativo você apresenta ele
aov_fung <- aov(sev ~ trat + rep, data = fungicidas)
summary(aov_fung)
Df Sum Sq Mean Sq F value Pr(>F)
trat 7 7135 1019.3 287.661 <2e-16 ***
rep 1 19 18.6 5.239 0.0316 *
Residuals 23 81 3.5
---
Signif. codes: 0 '***' 0.001 '**' 0.01 '*' 0.05 '.' 0.1 ' ' 1Verificar premissas
A média estimada é diferente da aritmética, de acordo com o modelo.
library(performance)
library(DHARMa)
check_normality(aov_fung)
OK: residuals appear as normally distributed (p = 0.230).check_heteroscedasticity(aov_fung)OK: Error variance appears to be homoscedastic (p = 0.484).plot(simulateResiduals(aov_fung))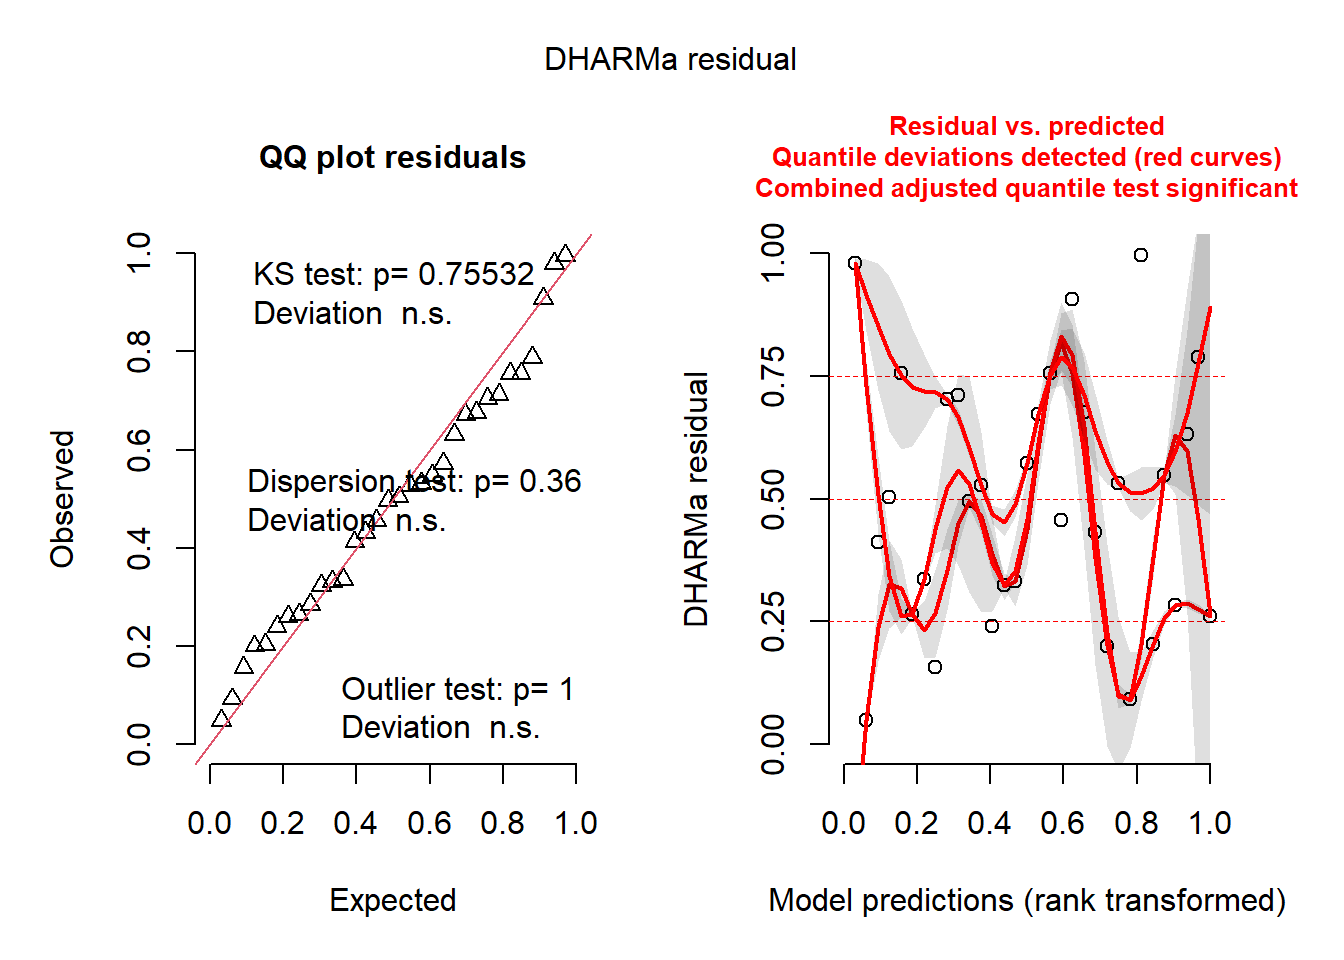
library(emmeans)
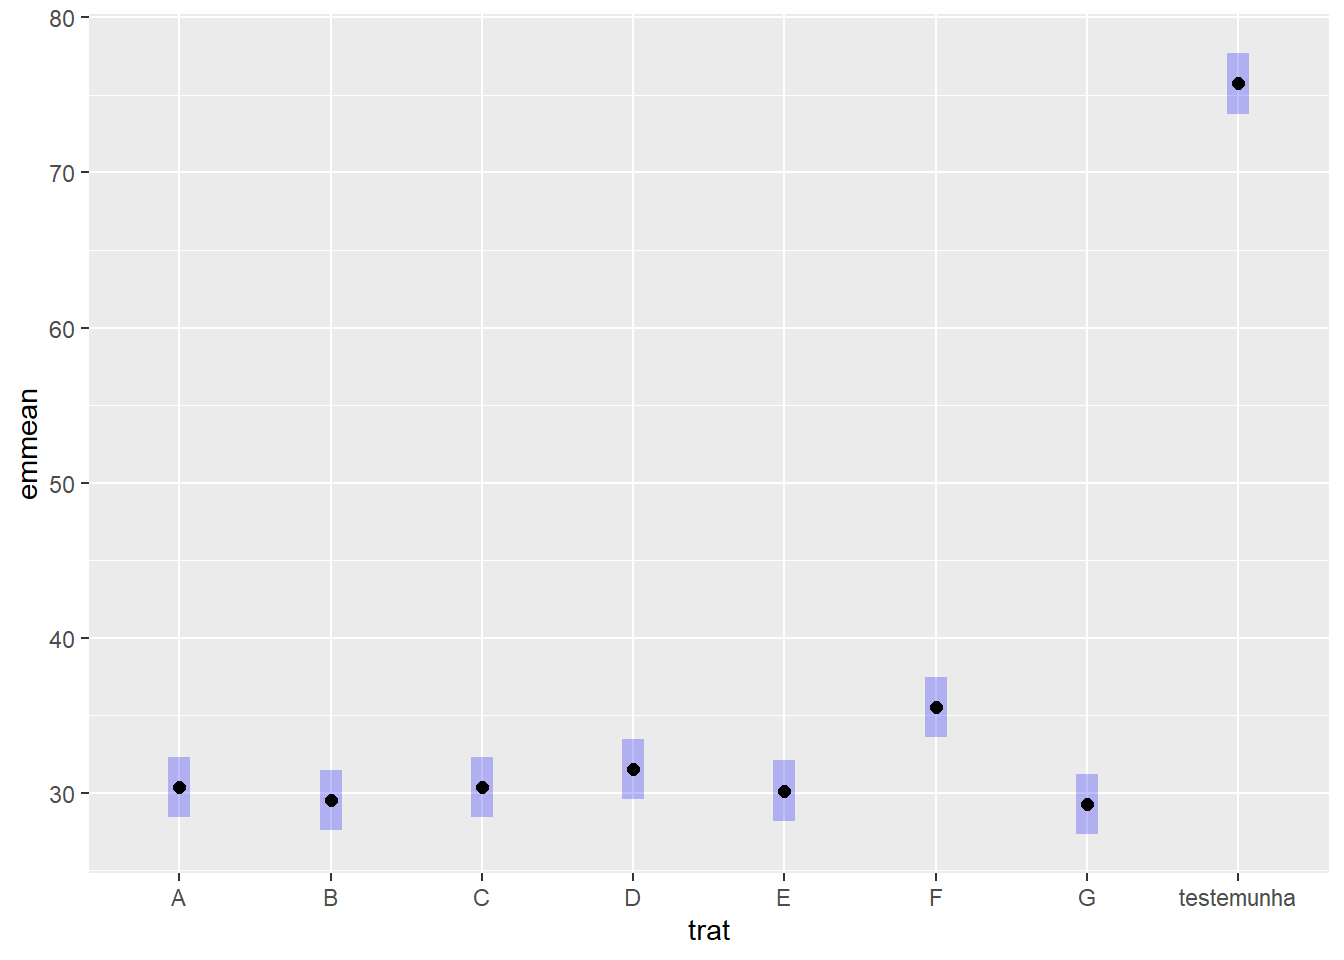
means_fung <- emmeans(aov_fung, ~trat)
library(multcomp)
library(multcompView)
cld(means_fung) trat emmean SE df lower.CL upper.CL .group
G 29.2 0.941 23 27.3 31.2 1
B 29.5 0.941 23 27.6 31.4 1
E 30.1 0.941 23 28.2 32.1 1
C 30.4 0.941 23 28.4 32.3 1
A 30.4 0.941 23 28.4 32.3 1
D 31.5 0.941 23 29.6 33.4 12
F 35.5 0.941 23 33.6 37.4 2
testemunha 75.8 0.941 23 73.8 77.7 3
Confidence level used: 0.95
P value adjustment: tukey method for comparing a family of 8 estimates
significance level used: alpha = 0.05
NOTE: If two or more means share the same grouping letter,
then we cannot show them to be different.
But we also did not show them to be the same. plot(means_fung)+
coord_flip()